Transportation
Illinois home electricity prices rise 6.8%, trailing U.S. jump of 15.4%
Prices in Illinois grew far more slowly than the national average over the past few years, but the newest monthly figures, which may be revised, put the state back above the U.S. by 0.9 cents per kWh.
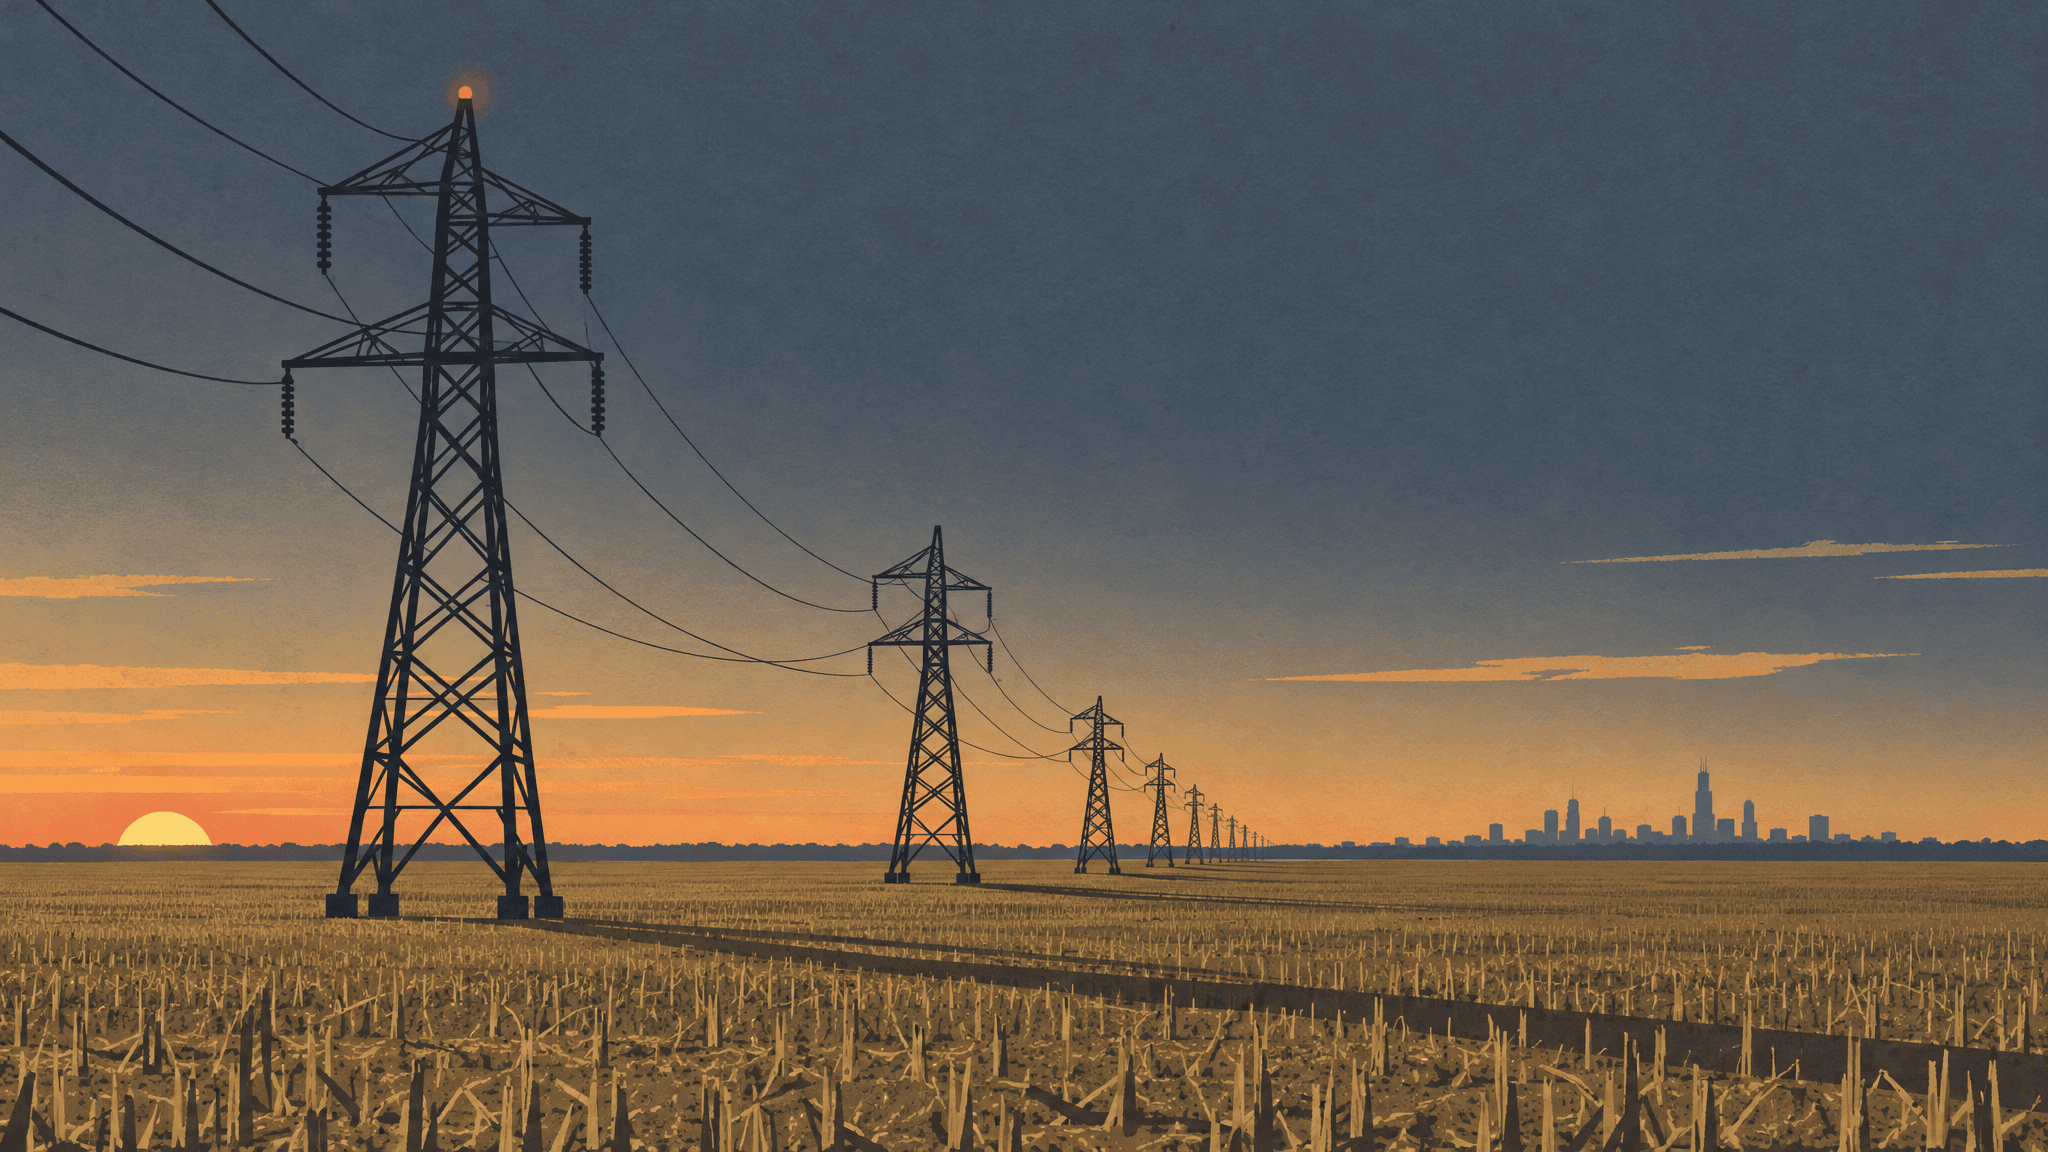
Illinois households paid more for electricity at the end of 2025 than at the end of 2022. But the state's prices climbed much more slowly than the nation's.
The average Illinois residential electricity price rose 6.8% from December 2022 to December 2025, according to the U.S. Energy Information Administration. The U.S. average rose 15.4% over the same stretch.
That difference matters as heating season begins across Chicagoland. For homes that heat with electricity or lean on space heaters, the price of each unit of power helps set the size of the winter bill.
Measured in cents, the Illinois average went from 16.0 cents per kWh in December 2022 to 17.1 cents per kWh in December 2025. That is an increase of 1.1 cents per kWh.
The national average moved from 14.9 cents per kWh to 17.2 cents per kWh over the same period. That is a rise of 2.3 cents per kWh, a bigger jump in both cents and percentage terms.
Illinois lost its price premium, then got it back
The slower climb in Illinois erased a gap that had put the state above the rest of the country. In December 2022, the Illinois price ran 1.0 cents per kWh higher than the national average.
By December 2025, the difference was -0.2 cents per kWh. That means Illinois had slipped just under the U.S. average, with the national price catching up and edging past it.
Illinois households did not get cheaper power during those years. Their prices still went up. They simply went up less than prices in much of the country.
The newest month tells a different story. In July 2026, the latest month available, the average Illinois residential price was 19.2 cents per kWh, compared with 18.3 cents per kWh nationally.
That put Illinois 0.9 cents per kWh above the U.S. average again. The edge Illinois held at the end of 2025 had disappeared by midsummer.
The monthly chart below shows how Illinois and national prices have tracked each other, crossed and pulled apart over time.
Readers should treat the July figures with some care. They are preliminary and may be revised when the agency updates its data.
They also come from summer. Comparing a July price with a December price mixes different seasons, so this report's main comparison uses the same month, December, across years.
Even with those cautions, the July numbers show Illinois prices running above the national average heading into fall. The question for winter budgets is whether that gap holds once colder months arrive.
What the data can and can't explain
The federal figures show what happened to prices. They do not show why Illinois and the nation moved at different speeds, and this report does not assign a cause.
Rates set by individual utilities feed into the statewide average. Ameren's electric supply rate for customers receiving basic generation service was set to rise temporarily, according to a local news report (25newsnow.com).
A change like that reaches only that utility's own customers. The statewide average blends households across different utilities, so a rate change at any company shows up only partly in the state number.
State policy is also part of the picture. The governor's office has said a state energy bill is expected to save Illinois consumers money over the coming decades (gov-pritzker-newsroom.prezly.com).
Whether those savings appear on monthly bills will take years of data to judge. The price figures in this report cannot measure the effect of that law on their own.
It also helps to remember what a price per unit does and does not tell a household. Your total bill depends on how much electricity you use, plus delivery charges and fees that vary by utility and plan.
A household that uses more power in winter will feel any price change more sharply. A household that uses less will feel it less, even at the same price.
What to watch this winter
Chicagoland households planning winter budgets can keep an eye on a few signals in the coming months.
- New monthly price figures from the Energy Information Administration, which will show whether Illinois stays above the national average through fall.
- Revisions to the July 2026 numbers, since the newest month is preliminary.
- December 2026 data, which will allow a clean same-month comparison with December 2025.
- Changes to utility supply rates, such as the temporary Ameren increase for basic generation service customers (25newsnow.com).
- Any sign in the price data that the state energy bill is affecting what households pay (gov-pritzker-newsroom.prezly.com).
For now, the record is mixed. From December 2022 to December 2025, Illinois held its price growth well below the national pace. By July 2026, though, Illinois had moved back above the U.S. average, and the coming winter months will show whether that shift sticks.
How we did this
We used monthly average residential electricity prices for Illinois and the United States from the U.S. Energy Information Administration. We compared December 2022 with December 2025 to avoid mixing seasons, calculating both the change in cents per kWh and the percent change, and we reported the gap between Illinois and the national average at each point. We also reported the newest available month, July 2026, separately.
Residential electricity price: the average amount households pay per kilowatt-hour of electricity, as reported by the U.S. Energy Information Administration. Kilowatt-hour (kWh): the standard unit for measuring electricity use on a utility bill. Basic generation service: the default electricity supply that a utility provides to customers who have not chosen a different supplier. Price gap: the Illinois average price minus the U.S. average price; a negative value means Illinois was below the national average.
Limitations
- The July 2026 figures are the newest available and are preliminary; they may be revised.
- July and December prices come from different seasons, so they should not be compared directly to measure a trend.
- These are statewide averages. Prices in Chicagoland, or for a given utility or plan, can differ from the Illinois average.
- The price per kWh is not the same as a household's total bill, which also depends on how much power is used and on delivery charges and fees.
- The data show how prices changed, not why. They cannot measure the effect of any single rate change or state law.
Sources
- U.S. Energy Information Administration (EIA): EIA electricity/retail-sales (monthly): price for stateid=IL, sectorid=RES, latest period July 2026; retrieved Oct. 13, 2026. Data
- U.S. Energy Information Administration (EIA): EIA electricity/retail-sales (monthly): price for stateid=US, sectorid=RES, latest period July 2026; retrieved Oct. 12, 2026. Data
More from The Messenger
- Transportation
18.0% of Cook County households have no vehicle
Oct. 12 - Crime & Public Safety
Car thefts climb in 45 Chicago community areas as citywide total rises
Oct. 11
Comments
Comments are free with a Messenger account.Sign in to comment
Loading comments…